

Power Laws in Culture, Revisited
An Inconvenient Truth

A central theme in books like Thinking, Fast and Slow, by the late Daniel Kahneman, and the Incerto series, by Nassim Taleb, is that humans aren’t good at thinking statistically. An example of this is what Kahneman called base rate neglect, the tendency to ignore the actual (and observable) likelihood of something happening.
This leads to both unwarranted pessimism and unrealistic optimism. The former includes, for instance, fear of flying or terrorism. Or fear of terrorism while flying. The latter is a prerequisite for pretty much anyone who tries anything ambitious, like opening a restaurant (80% fail within the first five years), founding a startup (reportedly between two-thirds and 90% fail), or writing a book (in 2021, less than 1% of the 3.2 million titles tracked by BookScan sold more than 5,000 copies). (And yes, I’m writing a book, which I know is delusional.)
In media, a common example of base rate neglect is a failure to understand (or perhaps internalize) power law-like popularity distributions. In practice, this means that there are a few big hits, a narrow middle and a nearly infinitely-long tail of misses. These distributions are found everywhere in media. Even though they are poorly understood, they are critically important.
In 2023, I wrote a post called Power Laws in Culture, which explained power laws, why they form in media, and why they’re important. Below, I revisit the logic, analysis, and implications.
Tl;dr:
Power law-like distributions are pervasive across media: a skinny head of a few hits, a dwindling middle, and a seemingly infinite tail of obscurity.
The long tail part is intuitive—there is a ton of stuff—but the skinny head of hits is not. It occurs because as more content is discovered and consumed on networks, people are increasingly influenced by others’ content choices, resulting in powerful positive feedback loops. Popularity begets more popularity, concentrating power at the top.
Why are people influenced by others’ choices? As the volume of content explodes and the cost of both choosing (search costs) and making a bad choice (opportunity costs) go up, people view popularity as an increasingly important signal of quality (an informational cascade). And as media becomes more social, content choices have more social currency (a reputational cascade).
I show an analysis of popularity distributions across Netflix series, U.S. box office, the top songs on Spotify, and the top games on Steam. All show high degrees of concentration in the top 1% and top 10% of titles. Concentration in the top 1% of titles ranges from 10-35% and in the top 10% of titles from 50%-90%.
The concentration of wealth is even more severe (and merciless) in the creator economy. Across YouTube, Spotify, Twitch, and Roblox, there is evidence that 99% of revenue accrues to less than 1% of creators.
There are several important implications: even as the volume of content approaches infinite, hits will persist; luck plays a surprisingly (and maybe discouragingly) large role in success, so hits can come from anywhere and aren’t necessarily correlated with quality; risk is rising and returns are falling across media; the formerly-lucrative middle is being hollowed out; and bargaining power is shifting to the top 0.1% of talent. GenAI will probably exacerbate all of that.
Creators and creatives need to be delusional for the system to work. Resource allocators can’t be. They need to understand that variance is climbing, governed by feedback loops and chance as much as skill. They also need to know where on the curve they’re playing. The right strategy depends on the answer.
What’s a Power Law?
Somewhere around 7th or 8th grade, we learn about the so-called “bell curve,” also called a Normal or Gaussian distribution. The logic behind a bell curve is intuitive: if you have enough random independent observations, most will be relatively close to the average (or mean) and equally distributed on either side of it.
When you walk through, say, an airport or down a busy street, you are subconsciously aware of the average height of the crowd and probably notice anyone who differs a lot. In the U.S. the average height of a man is about 5’9” and the standard deviation is about 3”. You would likely take note of any men more than three standard deviations away on either side—taller than 6’6” and shorter than 5’. But most people are clustered around the average. The number of tall people you see is not dependent on how many other tall people you see (unless a basketball team is walking through the airport, in which case the observations are not independent) and you won’t see any men who are 1” or 17’ tall.
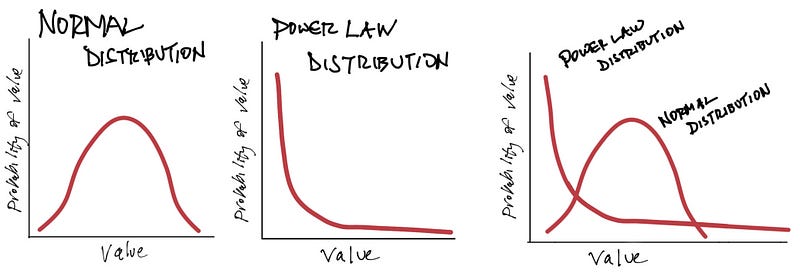
Figure 1. Normal and Power Law Distributions
Here’s how power law distributions differ, from Power Laws in Culture:
Power law distributions, by contrast, look very different. A power law simply means that the dependent variable is a “power” of the independent variable. For instance, the volume of a cube is a “power” of the length of the sides, because volume increases 3 units for each 1 unit in length. Generally, they can be expressed as:

In a power law probability distribution, the exponent is negative, which results in a downward sloping curve (as illustrated crudely in Figure 1).
For our purposes, the key distinction is illustrated on the far right of Figure 1. In a normal distribution most observations cluster around the mean (in a true normal distribution, 68% of observations fall within one standard deviation of the mean, 95% within two, and almost 100% within three). By contrast, extremely large and extremely small observations are much more likely in a power law distribution.
Power Laws are Prevalent in Media
In media, popularity almost always looks like a power law: a small number of big hits, a narrow middle, and a skinny long-tail of a vast number of misses.1 I’ll show several examples in the next section. But first let’s talk about why this happens.
Power laws occur in many natural phenomenon. For instance, the distribution of the magnitude of earthquakes (Gutenberg-Richter Law), words in written language (Zipf’s Law), traffic jams, and metabolic scaling of mammals (Kleiber’s Law). The mechanisms behind these physical and biological power laws are not always intuitively obvious (there is debate whether power laws are an inherent property of complex systems).
But the reasons are intuitive in media. Power law-like distributions occur because content choices are not independent.
Prior to the internet, media was one-way. It traversed down a linear value chain: it was produced, then distributed, and then consumed. Consumers had limited feedback mechanisms, other than voting with their eyeballs or wallets or talking at the water cooler. Today, most media is consumed on networks, on which each node influences, and is influenced by, other nodes.
While normal distributions occur in cases where the observations are independent and the differences between them are random and smoothed out, power laws are common in networks because network phenomena are dependent. Every node affects every other node, causing positive feedback loops. Variations in observations don’t cancel each other out, they multiply. This tendency for positive feedback loops on networks to lead to winner-take-all or winner-take-most outcomes is also called the Matthew effect (“the rich get richer and the poor get poorer”) or cumulative advantage.
Today, people’s content choices are highly dependent on other people’s content choices.
In other words, today people’s content choices are more highly influenced by other people’s content choices. But people aren’t nodes. Why are they influenced by others’ choices? For two chief reasons:
Keep reading with a 7-day free trial
Subscribe to The Mediator to keep reading this post and get 7 days of free access to the full post archives.